African Last-Mile Latency: An AFRICLOUD Measured Report
Published: · Updated: · 6 min read · By Oluniyi D. Ajao
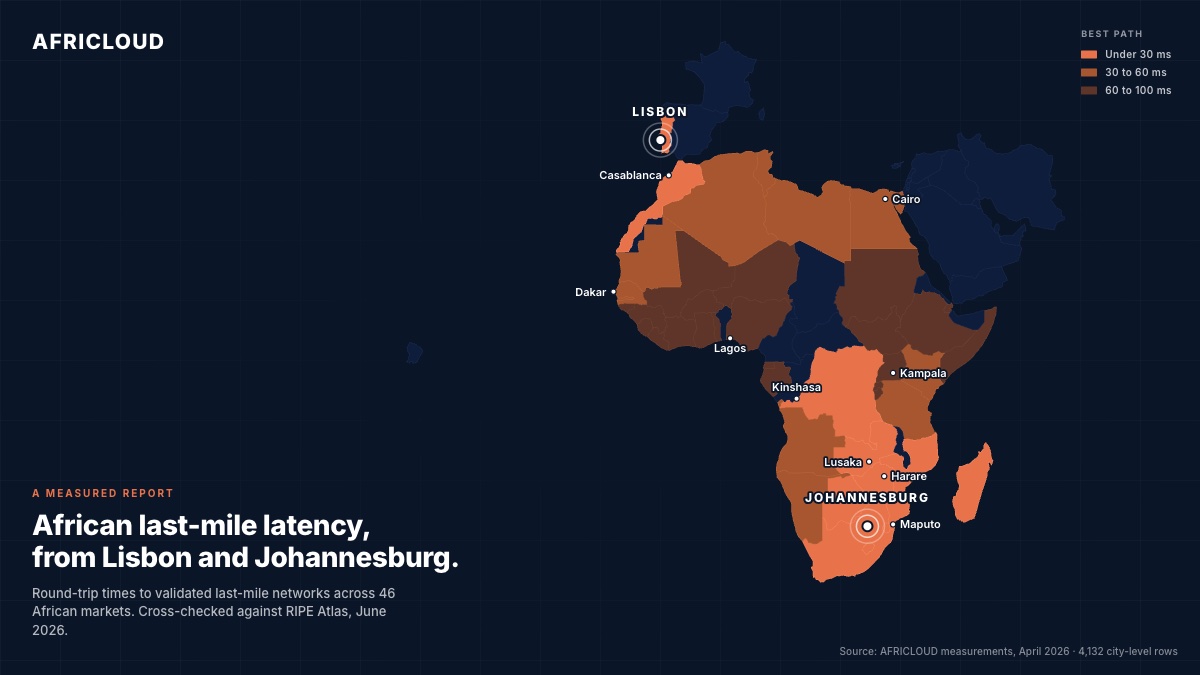
We measured round-trip latencies from our two regions to validated last-mile networks across Africa, then published the source data, methodology, and exclusions up front. The aim is to put numbers where the marketing language usually sits. This is a measured report, not a marketing claim.
The headline finding
Two regions. The right one depends on where your users are.
From our Lisbon region, the shortest measured paths to North and West Africa span 11 ms (Morocco) to 70 ms (Nigeria). From Johannesburg, the shortest paths to Southern and East Africa start at 4 ms (South Africa) and reach 62 ms (Uganda). The distance and topology mean that picking the wrong region for a market typically costs more than 100 ms, often more than 150 ms. No mid-region compensates: a Cairo user will not be well-served from Johannesburg, nor a Maputo user from Lisbon.
The decision rule is simpler than it looks: route by where your users live, not by where your team works.
Headline figures: Africa, measured
The numbers below are best observed paths to named cities, taken from a country-by-country measurement campaign across April 2026 (4,132 city-level rows), restricted to high-confidence rows with at least dozens of validated IPs per named city. Any minimum below 2 ms is excluded as it would reflect routes inside our own network rather than customer paths. The published number per market is framed as “as low as”, not as typical.
From our Lisbon region
| Market | As low as | Reference city (validated IPs) |
|---|---|---|
| Morocco | 11 ms | Casablanca / Rabat (164) |
| Algeria | 33 ms | Algiers (221) |
| Tunisia | 40 ms | Tunis (108) |
| Senegal | 42 ms | Dakar (41) |
| Egypt | 54 ms | Giza / Cairo (839) |
| Côte d’Ivoire | 61 ms | Abidjan (147) |
| Ghana | 67 ms | Accra (64) |
| Nigeria | 70 ms | Lagos / Lekki (274) |
For reference, the same Lisbon region measures around 28 ms to the UK, 29 ms to France, and 36 ms to the Netherlands. North African business that operates partly in Europe is not paying a regional penalty for that proximity.
From our Johannesburg region
| Market | As low as | Reference city (validated IPs) |
|---|---|---|
| South Africa | 4 ms | Bloemfontein (68); metros single-digit |
| Botswana | 5 ms | Gaborone (99) |
| Eswatini | 6 ms | Mbabane (125) |
| Mozambique | 7 ms | Maputo (58) |
| Lesotho | 8 ms | Maseru (38) |
| Zimbabwe | 17 ms | Harare (95) |
| Zambia* | 21 ms | Lusaka |
| DR Congo* | 27 ms | Kinshasa |
| Madagascar | 28 ms | Antananarivo (222) |
| Namibia | 34 ms | Windhoek (76) |
| Mauritius | 39 ms | Port Louis (104) |
| Tanzania | 45 ms | Dar es Salaam (888) |
| Kenya | 51 ms | Nairobi (885) |
| Angola | 52 ms | Luanda (89) |
| Rwanda* | 69 ms | Kigali |
| Uganda* | 62 ms | Kampala |
* For these markets, the published figure is the lower of our internal best-path minimum and an independent RIPE Atlas probe minimum measured June 2026. Where both methodologies were within 1 ms, the internal figure is used.
Across the Johannesburg region, the inner cluster (Botswana, Eswatini, Mozambique, Lesotho, Zimbabwe) sits under 20 ms, close enough that a single-digit number rounds up only when traffic exits and re-enters a metro fabric. The middle ring (Zambia, DR Congo, Madagascar, Namibia, Mauritius, Tanzania, Kenya, Angola) is in the 20-55 ms band, where Johannesburg keeps the user well inside what feels “local” to a web app. Madagascar is the small surprise here: a 28 ms best path despite the Indian Ocean geography, sustained across 222 validated last-mile IPs in Antananarivo. The outer ring (Rwanda, Uganda) crosses 60 ms, where the user begins to feel latency on chatty workloads but stays clear of the 150-300 ms range typical of off-continent routing.
Methodology, briefly
We measured round-trip times to last-mile IPs registered to African operators across April 2026. Per-city rows were retained only at high confidence, with at least dozens of validated IPs per named city. The published number per market is the lowest best-path latency to a named, well-sampled city, framed as “as low as”, not “typical”.
These figures were cross-checked against RIPE Atlas probe minimums measured June 2026 from both our regions. Where RIPE probe coverage is dense (Southern and Eastern Africa), the two methodologies agree closely: Zambia 21 ms internal vs 21.3 ms RIPE minimum; Zimbabwe 17 vs 18.2; Mauritius 39 vs 41.4. Where they disagree on the Johannesburg side, we publish the lower of the two; Uganda, for example, measures 62 ms to a well-routed Kampala research network on RIPE Atlas, faster than our 78 ms broader AFRINIC last-mile figure. On the Lisbon side, RIPE probe coverage is sparser and skewed toward research and academic networks, so probe minimums there run 20-70 ms slower than what well-routed commercial last-mile networks observe. Senegal is the cleanest match (RIPE 41.7 ms vs our 42 ms), confirming the underlying methodology where probe coverage is dense enough to corroborate cleanly.
We do not publish averages. Country-wide averages bury well-routed paths under poorly-routed rural last-mile IPs and outlier tails: in Angola the country-wide average is 78 ms with a maximum of 577 ms, when the best path to Luanda is 52 ms. Headline averages overstate real-world latency for the audience that matters, the user on a competently-routed network. We also do not publish minimums below 2 ms, which would reflect routes inside our own network rather than customer paths. The South Africa headline is therefore 4 ms (Bloemfontein) and not the 0.2 ms that several Johannesburg probes report.
This sits in the same trust register as our public software mirror work: the underlying infrastructure is publicly inspectable, the figures are reproducible from RIPE Atlas, and exclusions are stated rather than hidden.
How to choose your region for African users
| If your users mostly live in | Pick the region |
|---|---|
| North Africa (MA, DZ, TN, EG, LY) | Lisbon |
| West Africa (SN, CI, GH, NG, ML, BF, BJ, TG) | Lisbon |
| Southern Africa (ZA, BW, SZ, MZ, LS, NA, ZW) | Johannesburg |
| East Africa (TZ, KE, UG, RW, BI) | Johannesburg |
| Central Africa (CD, AO, CG) | Johannesburg |
| Indian Ocean (MU, SC, MG) | Johannesburg |
There is no in-between case. A user in Casablanca reaches our Lisbon region in 11 ms but our Johannesburg region in 196 ms. A user in Johannesburg reaches Johannesburg in single digits but Lisbon in roughly 112 ms. Either region serves the other half of Africa adequately for redundancy or disaster recovery; for primary serving traffic, the choice is binary. A longer-form treatment of what each region is and is not well-suited for sits in our Lisbon versus Johannesburg comparison piece.
Where we are not yet fast
We will be more credible long-term if we are honest about the markets where neither of our regions is the fastest commercial option. From this measurement run, the markets where both regions land above 150 ms include Cameroon (best-path Lisbon 179 ms, Johannesburg 198 ms) and Chad (Lisbon 126 ms, Johannesburg 354 ms). Neither shows a path that benefits from our Atlantic-facing or Southern-African topology in a useful way; we do not currently recommend either region for primary serving traffic in those markets.
A handful of additional markets show a wide measurement gap between our two regions and would benefit from further peering work on our end. That work is ongoing. We publish where we are slow the same way we publish where Mobile Money checkout is live and where it is not: infrastructure transparency is a feature, not a trade-off.
Data, methodology, citation
The full underlying dataset is available on request for academic, journalism and infrastructure-research use. Researchers and journalists wanting to cite this report can contact us via the AFRICLOUD support channel. Live latency from any specific source network can be checked against our public Looking Glass at https://lg.africloud.com.